A label says 24 percent THC. Another laboratory measures 21 percent. The arithmetic looks simple until someone asks where the laboratory got its sample. Was it the same portion of material, another flower from the same package or an entirely different package from the production lot? Those three comparisons test three quite different sources of disagreement.
Start at the shop counter
For a Colorado study of flower and concentrate labels, researchers purchased products from licensed dispensaries and recorded information from the packaging. Buying retail material lets investigators study the claim presented to a customer. An earlier retail flower study likewise compared independently measured THC with the amounts on dispensary labels. Retail purchasing also means investigators usually cannot replay the original sampling event at which a producer’s lot was tested. A discrepancy raises a question about the label, but it does not automatically reveal where along the way the difference arose.
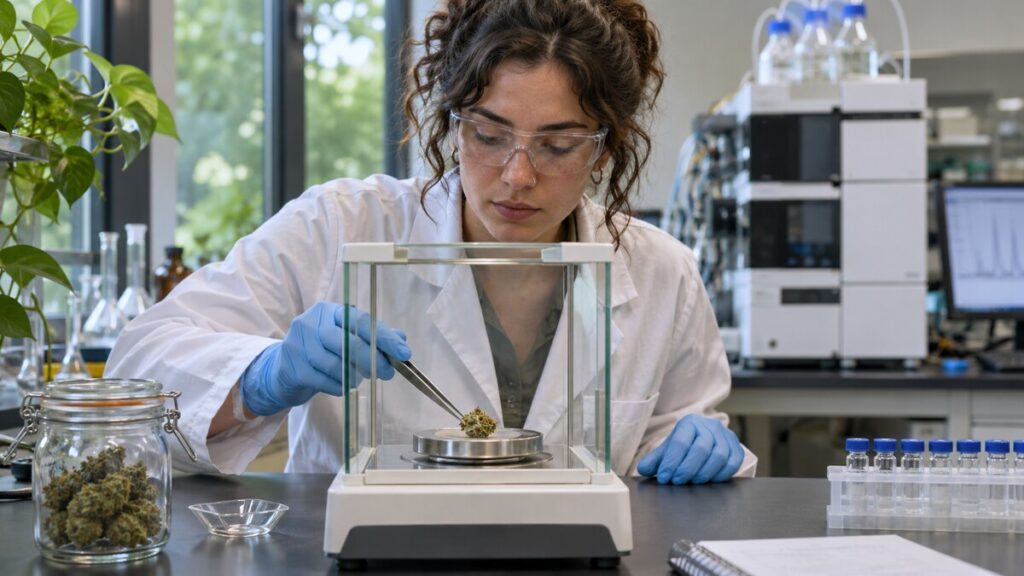
A cannabis flower is a heterogeneous piece of a plant. Glandular structures accumulate cannabinoids, and their distribution and development matter to what a particular piece contains. Microscopy of maturing cannabis flowers offers a visual reminder of that variability. Before measuring a tiny portion, an analyst needs a defensible way of making it representative of the material whose potency the report claims to describe.
Three points or twelve percent?
In the hypothetical example, the measured value is three percentage points below the label. Relative to the stated value, the difference is twelve and a half percent. Both calculations are correct. They answer different questions. A report that says only that two measurements differed “by three percent” leaves readers to guess which denominator the author used.
A further complication is the definition of the number on the label. THC and its acidic precursor are chemically distinct. Reports may list them separately or express a calculated total THC potential that accounts for the mass change when the precursor loses carbon dioxide. A measured value for one compound and a label reporting a calculated total cannot be compared fairly until the quantities have the same definition. Moisture conventions and units deserve the same attention.
Give several laboratories the same material
One way to isolate analytical disagreement is to distribute a common material to different labs. The NIST Cannabis Laboratory Quality Assurance Program uses exercises of this kind. When laboratories receive comparable samples, the spread in their answers becomes evidence about measurement and reporting. It says less about the variation among flowers on a shop shelf because the exercise deliberately controls that part of the problem.
An especially useful exercise asks each laboratory to report uncertainty as well as its best estimate. A result with a narrow uncertainty range makes a different promise from the same number reported as a rough approximation.
The reverse design is useful too. One laboratory can analyze several independently sampled portions of one package. If repeat readings on the same prepared extract agree closely but independent portions differ, simply running the instrument again will not resolve the main uncertainty. The analyst needs to look earlier in the chain, at how the sample was selected and prepared.
What one discrepancy can establish
Suppose a package falls outside a study’s chosen tolerance. That observation belongs to a particular package, test and rule. Estimating how common such discrepancies are requires enough independently chosen packages. Inferring intentional inflation is a further step still. A sample from a market can reveal a systematic pattern without identifying the motive behind any single label.
The most interesting information in a retesting paper is often in its methods. Look for who bought the material, how the packages were chosen, what counted as agreement and whether the reported number was measured or calculated. With those details, the difference between 24 and 21 percent becomes a question a scientist can investigate. Without them it is merely a pair of impressively precise numbers printed on different pieces of paper.